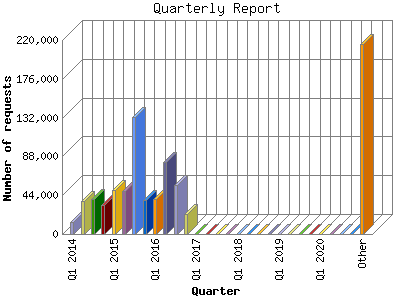
The Quarterly Report shows total activity on your site for each quarter of a
year. Remember that each page hit can result in several server requests as the
images for each page are loaded.
Note: Most likely, the first and
last quarters will not represent a complete quarter's worth of data, resulting
in lower hits.
| Quarter | Number of requests | Percentage of the requests | |
|---|---|---|---|
| 1. | Q2 2026 | 47,813 | 4.88% |
| 2. | Q1 2026 | 53,747 | 5.49% |
| 3. | Q4 2025 | 39,007 | 3.98% |
| 4. | Q3 2025 | 31,029 | 3.17% |
| 5. | Q2 2025 | 30,679 | 3.13% |
| 6. | Q1 2025 | 30,595 | 3.12% |
| 7. | Q4 2024 | 23,978 | 2.45% |
| 8. | Q3 2024 | 34,657 | 3.54% |
| 9. | Q2 2024 | 25,724 | 2.62% |
| 10. | Q1 2024 | 22,515 | 2.30% |
| 11. | Q4 2023 | 19,908 | 2.03% |
| 12. | Q3 2023 | 27,086 | 2.76% |
| 13. | Q2 2023 | 0 | 0.00% |
| 14. | Q1 2023 | 0 | 0.00% |
| 15. | Q4 2022 | 0 | 0.00% |
| 16. | Q3 2022 | 0 | 0.00% |
| 17. | Q2 2022 | 0 | 0.00% |
| 18. | Q1 2022 | 0 | 0.00% |
| 19. | Q4 2021 | 0 | 0.00% |
| 20. | Q3 2021 | 0 | 0.00% |
| 21. | Q2 2021 | 0 | 0.00% |
| 22. | Q1 2021 | 0 | 0.00% |
| 23. | Q4 2020 | 0 | 0.00% |
| 24. | Q3 2020 | 0 | 0.00% |
| 25. | Q2 2020 | 0 | 0.00% |
| 26. | Q1 2020 | 0 | 0.00% |
| 27. | Q4 2019 | 0 | 0.00% |
| 28. | Q3 2019 | 0 | 0.00% |
| 29. | Q2 2019 | 0 | 0.00% |
| 30. | Q1 2019 | 0 | 0.00% |
| 31. | Q4 2018 | 0 | 0.00% |
| 32. | Q3 2018 | 0 | 0.00% |
| 33. | Q2 2018 | 0 | 0.00% |
| 34. | Q1 2018 | 0 | 0.00% |
| 35. | Q4 2017 | 0 | 0.00% |
| 36. | Q3 2017 | 0 | 0.00% |
| 37. | Q2 2017 | 0 | 0.00% |
| 38. | Q1 2017 | 0 | 0.00% |
| 39. | Q4 2016 | 22,863 | 2.33% |
| 40. | Q3 2016 | 55,898 | 5.71% |
| 41. | Q2 2016 | 81,633 | 8.33% |
| 42. | Q1 2016 | 40,069 | 4.09% |
| 43. | Q4 2015 | 38,575 | 3.94% |
| 44. | Q3 2015 | 132,191 | 13.49% |
| 45. | Q2 2015 | 48,796 | 4.98% |
| 46. | Q1 2015 | 49,351 | 5.04% |
| 47. | Q4 2014 | 33,200 | 3.39% |
| 48. | Q3 2014 | 39,584 | 4.04% |
| 49. | Q2 2014 | 36,946 | 3.77% |
| 50. | Q1 2014 | 13,954 | 1.42% |
Most active quarter Q3 2015 : 132,191 requests handled.
Quarterly average: 40,824 requests handled.
This report was generated on June 30, 2026 03:11.
Report time frame March 4, 2014 16:52 to June 29, 2026 23:58.
| Web statistics report produced by: | |
 Analog 6.0 Analog 6.0 |  Report Magic 2.21 Report Magic 2.21 |